The column below reflects the views of the author, and these opinions are neither endorsed nor supported by WisOpinion.com.
Why is Robin Vos now amenable (SCOWIS issues aside) to a redistricting commission similar to the one proposed by the Democrats in 2019? The short answer is that he knows that his party will not be hurt much by Assembly maps that are compact (as measured by Reock) and minimize county splits and split municipalities.
Wisconsin Maps Assessment Project (WIMAP) has been collecting legislative and congressional maps ever since the census figures came out in mid-August of 2021. We have a collection of 24 Assembly maps which include all six of the Johnson I case maps, the PMC final Assembly map, some different versions that the PMC put out and all the Assembly maps submitted to the Legislature’s Draw Your District (DYD) portal that meet the criteria specified below.
These maps have been analyzed consistently by one entity, Dave’s Redistricting App (DRA) so that they can be compared on a level playing field (no experts to fudge the figures). To make the collection, the Assembly maps must have less than 2% total deviation (plus or minus 1% from ideal as specified by AD415) and be numbered so that they produce viable Senate maps. 24 maps tell you a lot more than 6.
>> WisPolitics is now on the State Affairs network. Get custom keyword notifications, bill tracking and all WisPolitics content. Get the app or access via desktop.
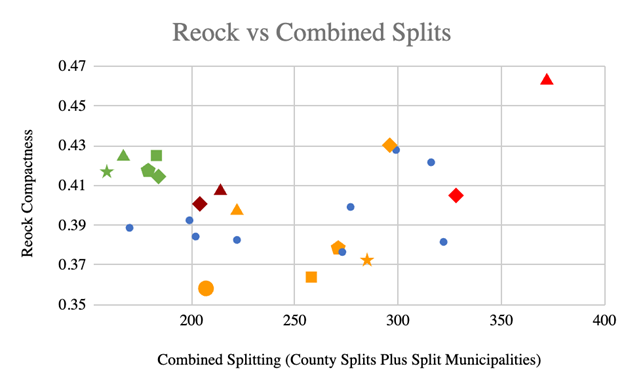
Here are the 24 maps plotted with their DRA Reock scores versus the number of county splits plus split municipalities (cities, villages, and towns).

The geographically ideal maps are those colored in green which are high in compactness and low in splitting. The map represented by the green pentagon is from Joe Handrick (submitted to the DYD portal). Joe, as you recall, was heavily involved in the 2011 maps. He is a solid mapper and knows what he is doing. By the way, the maps colored orange are the Johnson I maps with SB621 being the orange circle. SB621 has decent splitting due to the legislature’s priority of minimizing muni splits (it does not do so well with county splitting). However, SB621 has the worst Reock compactness score of the 24 maps in the WIMAP collection and would be rejected immediately by the LRB.
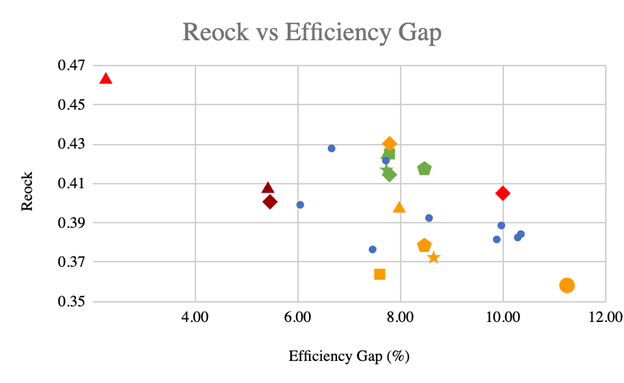
This next chart shows Reock graphed against efficiency gap, a traditional measure of partisan fairness. Efficiency gap is the difference between the two parties’ “wasted votes” (votes for a party’s losing candidates plus votes for a party’s winning candidates more than the minimum needed to win) divided by the total number of votes. It is a measure devised by University of Chicago law professor Nicholas Stephanopoulos and political scientist Eric McGhee in 2014. An efficiency gap above 7% or below -7% for states with two equally popular parties can be considered gerrymandered.

Note that all the green maps have efficiency gap scores around 8%. That is a better result than the 11.25% efficiency gap recorded by DRA for SB621, but still very favorable for the Republicans in a purple state. Perhaps Vos is settling for the Handrick map. Incidentally the PMC Assembly map and a variation of it (colored in purple) have efficiency gap scores under 6%, but they would lose out to the Handrick map on pure geographic criteria (compactness and splitting) alone. This is why the efficiency gap wording in the 2019 proposal is crucial for the Democrats. It is missing in AD415. No one seems to be pointing this out.
DRA’s Alec Ramsay has written an article on why superior compactness does not necessarily lead to a proportional (partisan fair) map. He gives an example of a Pennsylvania Congressional map that is very compact but is not proportional. A proportional representation for the PA map would result in a 10-8 split in favor of the Democrats. The compact map flips the representation to exactly the opposite, 10 – 8 in favor of the Republicans. Pennsylvania is much like Wisconsin in its political geography with Philadelphia and Pittsburgh leaning heavily Democratic, but the state having only a 52.80% Democratic vote share. Similarly, Wisconsin has the traditionally Democratic strongholds of Milwaukee and Madison and a near equally balanced partisan make-up statewide.
https://medium.com/dra-2020/compact-districts-arent-fair-7c17c2ff5d7e
— Don Leake of the WI Map Assessment Project is a retired UW-River Falls math professor.


