The column below reflects the views of the author, and these opinions are neither endorsed nor supported by WisOpinion.com.
Two years ago, Tony Evers signed state legislative district maps into law ending over two decades of partisan gerrymandering. Many things had to come into place for this minor miracle to happen: the election of Justice Janet Protasiewicz establishing a liberal WI Supreme Court, the Clarke v. WEC challenge, and finally, the report by court-appointed map experts, Dr. Bernard Grofman and Dr. Jonathan Cervas. That report criticized the partisan bias of the state’s Assembly and Senate maps and lauded the Evers-proposed maps. Seeing that this report would bring almost certain court defeat, the Republicans capitulated and passed the governor’s maps.
Because the Clarke case was based on the non-contiguity of state legislative map districts, the WI Congressional map was left out. How would the current Congressional map, constructed to meet the now discredited “least-change” constraint, fare if it were thoroughly inspected for partisan bias as in the G & C report?
Grofman and Cervas wanted to show “how the arrangement of voters into constituencies in different ways in different plans biases or does not bias the likelihood that the majoritarian principle will be satisfied.” In addressing political neutrality, they straightforwardly computed for any given districting map its level of majoritarian concordance, the proportion of elections in which, “the party whose candidate wins the majority of two-party votes also finds itself in a legislative majority.” In their report, G & C considered the voting profiles of all 13 statewide elections from 2016 – 2022 (two presidential, three senate, two gubernatorial, two secretary of state, two treasurer, and two attorneys general). Adding the two 2024 elections for president and senate to this set, yields 15 total statewide elections in the most recent decade.
>> WisPolitics is now on the State Affairs network. Get custom keyword notifications, bill tracking and all WisPolitics content. Get the app or access via desktop.
The graph below summarizes the 2022 Congressional map’s distribution of votes for the Democratic candidate in these 15 elections. The five Republican and ten Democratic wins are organized by increasing statewide Democratic vote percentage. The vote percentages presented on the graph’s horizontal axis are adjustments reflecting a two-party race. For example, the leftmost entry of 48.3% stands for Russ Feingold’s vote share as if only he and Ron Johnson received votes in the 2016 race for Senate. The actual percentages in the election were 46.81% and 50.17%, respectively. The rightmost 55.4% represents the adjusted vote share for Tammy Baldwin’s victory in 2018, considered a “blowout” of an almost 11% margin. Note that the elections represented in the graph are relatively close. Yet, these 15 voting profiles superimposed on the 2022 Congressional map reflect only two competitive districts, 1 and 3. Districts 2 and 4 are Democratic strongholds, Districts 5 – 8 Republican ones. The district percentages naturally show responsive shifts at the edges as the Democratic vote share gets farther from 50%.
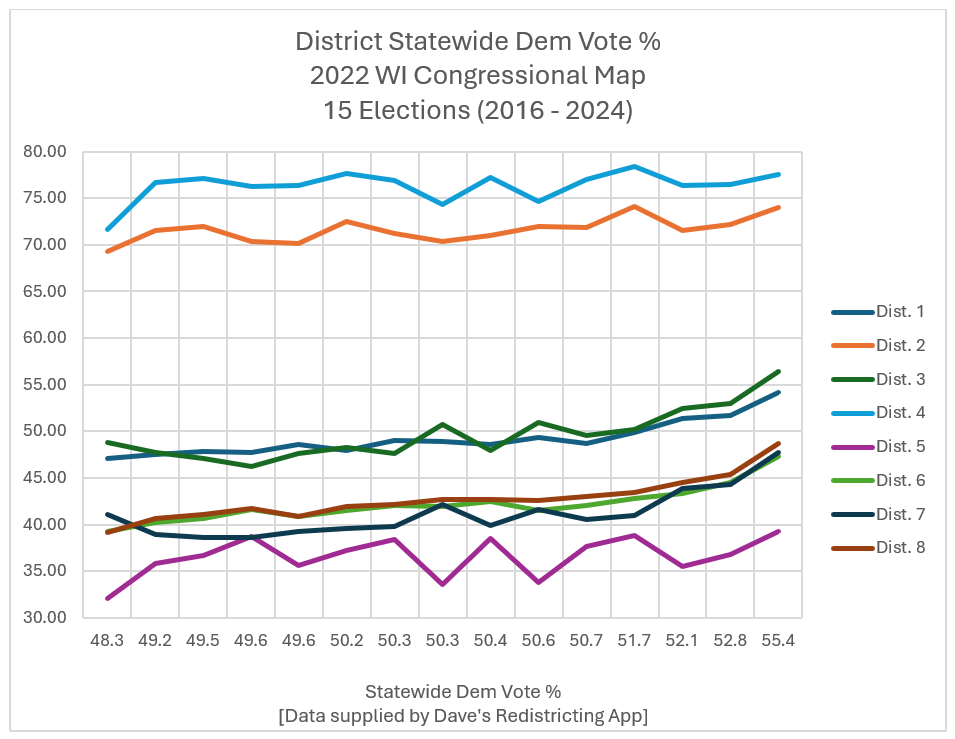
Since Wisconsin has 8 Congressional districts, we shall consider the winning of four of those districts a majority. Note that in the first five elections when the Democratic candidate garners less than 50% of the statewide vote, majoritarian concordance is achieved as the Republicans “win” 6 out of the 8 Congressional seats. Majoritarian concordance is also achieved in the last three elections with the Democrats “winning” 4 of the 8 seats. The election in which the Democratic candidate won a vote share of 51.7% is so close in District 1 (the actual number is 49.92%) that it does not seem fair to count this result either way. Thus, the 2022 Congressional map has an overall majoritarian concordance of 8/14 ~ 57.1%. We can compare this to the G & C report’s average majoritarian concordance for the 2022 Assembly and Senate maps (38.5%) and the revised 2024 “fairer” maps (76.9%). Note also the asymmetry evidenced by majoritarian concordance achievement for all five elections in which the Republican candidate won, but in only three of the nine Democratic-won elections that we are considering.
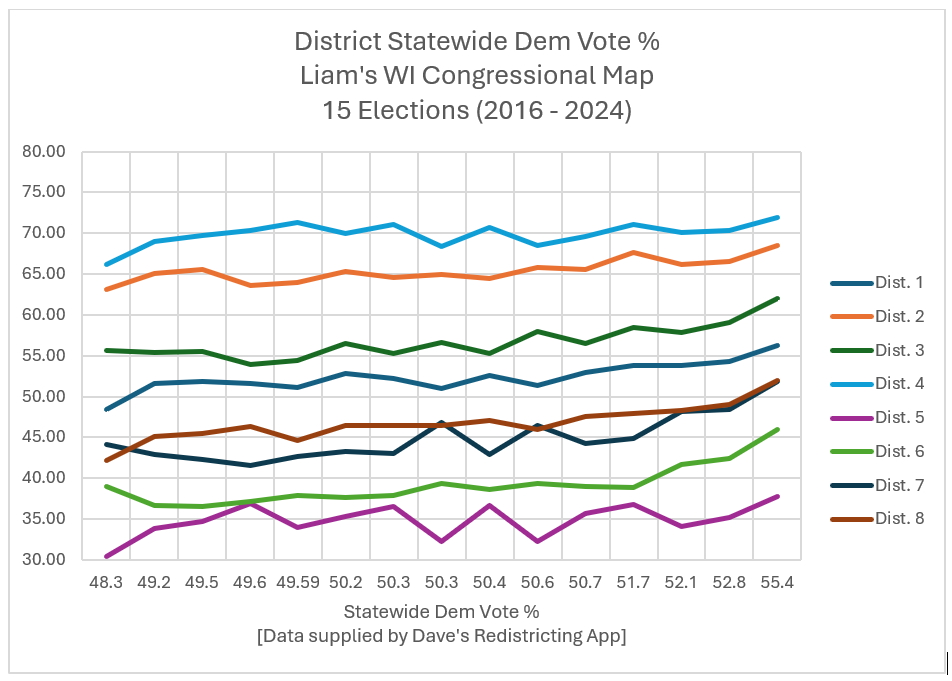
It is easy to see how majoritarian concordance could be improved in a revised map. The lines representing Districts 1 and 3 simply need to be raised by about 5%. As an example, the graph below shows a 100% majoritarian concordance for this map published on Dave’s Redistricting App by whickey. There are many more similar maps published on DRA. Whoever is assigned to draw the 2030 Congressional map should include majoritarian concordance in its analysis of political neutrality.
Don Leake of the WI Map Assessment Project is a retired UW-River Falls math professor.
