The column below reflects the views of the author, and these opinions are neither endorsed nor supported by WisOpinion.com.
Currently, nineteen states have some sort of language prohibiting partisan bias in the construction of Congressional redistricting maps. Assuming Wisconsin will ultimately join these ranks through legislation or a constitutional amendment, how will our state practically implement political neutrality in its maps? A look at the performance of nine DRA partisan bias metrics computed for a decade of WI statewide elections provides some insight.
The graph below gives the values of nine partisan bias metrics reported by Dave’s Redistricting App for 15 WI statewide elections from 2016 – 2024 (three presidential, four senate, two gubernatorial, two secretary of state, two treasurer, and two attorneys general). The metrics are computed by counting the red/blue votes of the 15 elections as determined by the 2022 WI Congressional map. The elections are organized by increasing the Democratic vote percentage presented on the graph’s horizontal axis with adjustments made to reflect a two-party race. Note that 10 of the Dem vote percentages fall between 49 and 51 reflecting the fact that WI is a purple state. The 48.3% outlier to the left represents Russ Feingold’s vote share as if only he and Ron Johnson received votes in the 2016 Senate race. The rightmost 55.4% represents the adjusted vote share for Tammy Baldwin’s Senate victory in 2018. Descriptions of all of the metrics provided by Alec Ramsay of DRA can be found here.
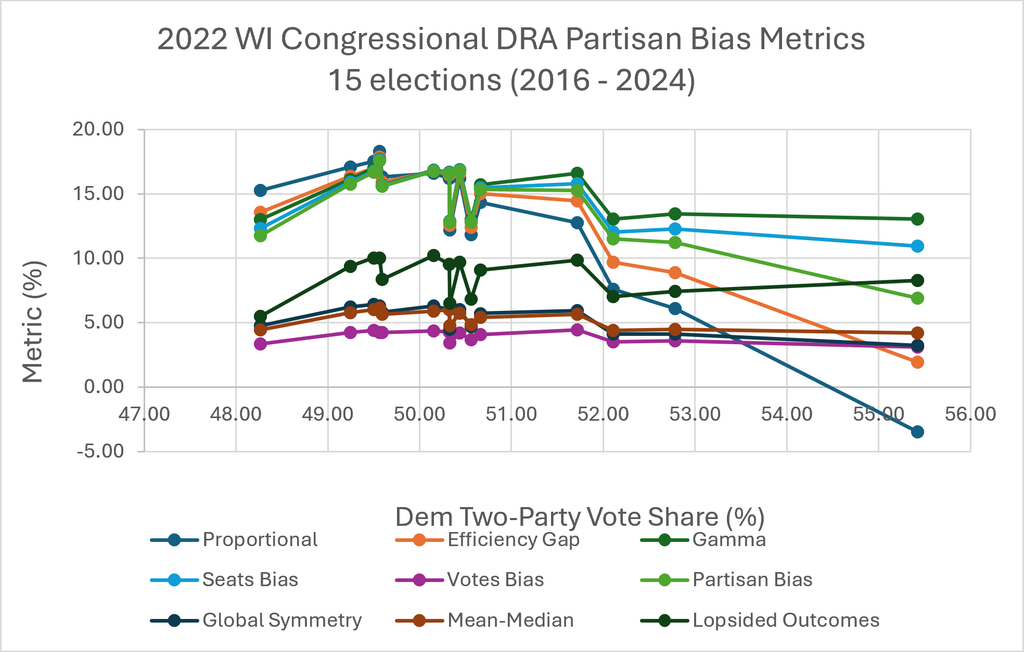
The partisan bias metrics for a politically neutral map should be close to 0%. Positive values indicate that the map favors Republicans, negative values favor Democrats. It is quite evident that the 2022 Congress significantly favors Republicans assuming that the DRA metrics are valid measures of partisan bias. As an example, the seats bias metric (in blue) has a median value of 15.65%. Since one seat out of 8 represents 12.5% of the WI Congressional delegation, this suggests that the current map carries with it a 5 seats to 3 Republican advantage.
The graph identifies which metrics tend to have higher values and which are naturally lower. For this map the metrics: proportional, efficiency gap, gamma, seats bias, and partisan bias all have medians around 15%. Votes bias, global symmetry, and mean-median tend to hover around 5%. The metric lopsided outcomes varies around 9%. The graph also shows that the proportional and efficiency gap metrics, and to a lesser extent, the partisan bias metric are sensitive to higher Dem winning percentages in WI, while the other two higher-value metrics, gamma and seats bias, remain relatively constant. Metrics that remain relatively invariant over varied voting profiles should be preferred to those which don’t. After all, the map stays the same, why should the metric that purports to measure its partisan bias change with Dem vote share?
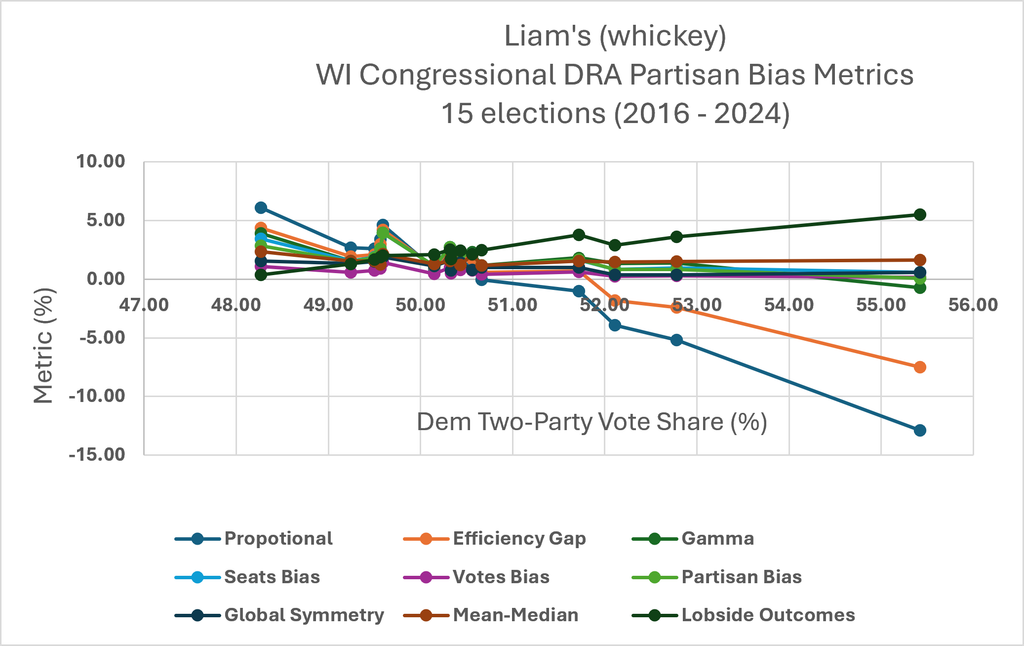
Whoever is entrusted with selecting a politically neutral 2032 WI Congressional map will have to defend their choice against other viable alternatives. Below is a comparable graph showing the DRA partisan bias metrics for this map published by whickey on DRA. In a previous article it was noted that this map scored a perfect 100% in majoritarian concordance (the party whose candidate wins the majority of two-party votes also finds itself in the Congressional map majority) while the current WI Congressional map scored less than 60%. Note first that the metric values mostly are found in the 0% to 3% range indicating that this map is much more politically neutral than the current one. Secondly, as in the first graph, the proportional and efficiency gap metrics decrease significantly once the Dem two-party vote percentage exceeds 52% indicating that one should be wary of using these two DRA metrics in determining partisan bias.
The use of actual voting profiles lends credibility to partisan bias analysis. The votes are real, only their partitioning is theoretical. Graphs like the two above give context to the numbers purporting to quantify the political bias of redistricting maps. Metric values associated with individual elections give a more robust view of how the measures are affected by vote share than those computed for a composite of selected elections. Range and sensitivity to vote share are much more evident. Data such as these make it clear how maps can be quantitatively compared by partisan bias. DRA metrics are cost-free and readily available to the public. The methodology for their computation is completely transparent. Thanks to apps like DRA, when redistricting is done again in 2030 there will be no democratically legitimate excuse to not have politically neutral maps. The entire nation will be watching.
Don Leake of the WI Map Assessment Project is a retired UW-River Falls math professor.